

Projects
Big Data : Design and implementation of high-performance resilient storage system on AWS to analyse GDELT Database
The GDELT Project monitors the world’s broadcast, print, and web news from nearly every corner of every country in over 100 languages and identifies the people, locations, organizations, themes, sources, emotions, counts, quotes …in the entire world. With new files uploaded every 15 minutes, GDELT data bases contain more than 500 Gb of zipped data for the single year 2018.
We designed a high-performance distributed storage system on AWS that can analyze the events of the year 2018 through their story in the world media collected by GDELT. The goal is to analyze trends and relationships between different country actors.
- We used spark as an ETL , with its native language Scala: we created a first script that loads the data in S3 , format parquet, and a second script scala to do the intermediate data processing and deposit the cleaned data on MongoDB & Cassandra instances deployed on AWS.
- We request the databases from python with the appropriate connectors of each base (with pymongo for MongoDB for example)
- We used Flask for the visualization part
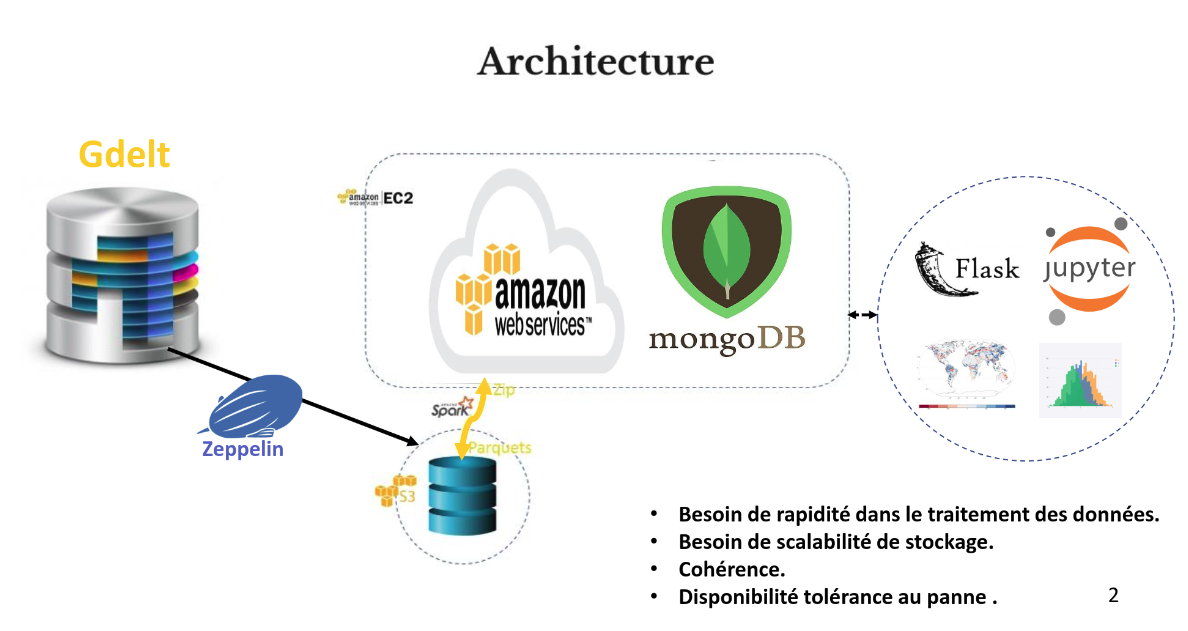
Keywords: AWS EC2, ZooKeeper, S3, Zepplin, scala, mongoDB, Cassandra, Flask, Python
See GitHub page : https://github.com/kasamoh/NoSQL/tree/master/Projet_gdelt
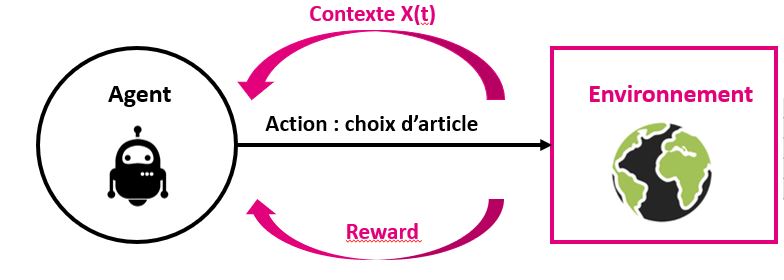
Reinforcement Learning : Deep Reinforcement learning for recommender system
Build A recommender system for Vente-privee.com using Reinforcement Learning and Bayesian Networks . Keywords : Contextual bandits , Gym , Neural Networks , Bayesian Analysis , Python , Docker , Tensorflow
See GitHub page : https://github.com/kasamoh/vente-privee_telecom_reco_gym
Metric Learning and XGBOOST : Estimating a position from a received signal strength for IoT sensors
Smart devices such as IoT sensors use low energy consuming networks such as the ones provided by Sigfox or Lora. But without using GPS networks, it becomes harder to estimate the position of the sensor. The aim of this study is to provide a geolocation estimation using Received Signal Strength Indicator in the context of IoT. The aim is to allow a geolocation of lowconsumption connected devices using the Sigfox network. State of the art modelsare able to be precise to the nearest kilometer in urban areas, and around tenkilometers in less populated areas.
Keywords : Metric Learning , KNN , Xgboost , IoT , Python

See GitHub page: https://github.com/kasamoh/IoT
Flask : an app for movies website
A design of a Flask app for movies website with python and MongoDB
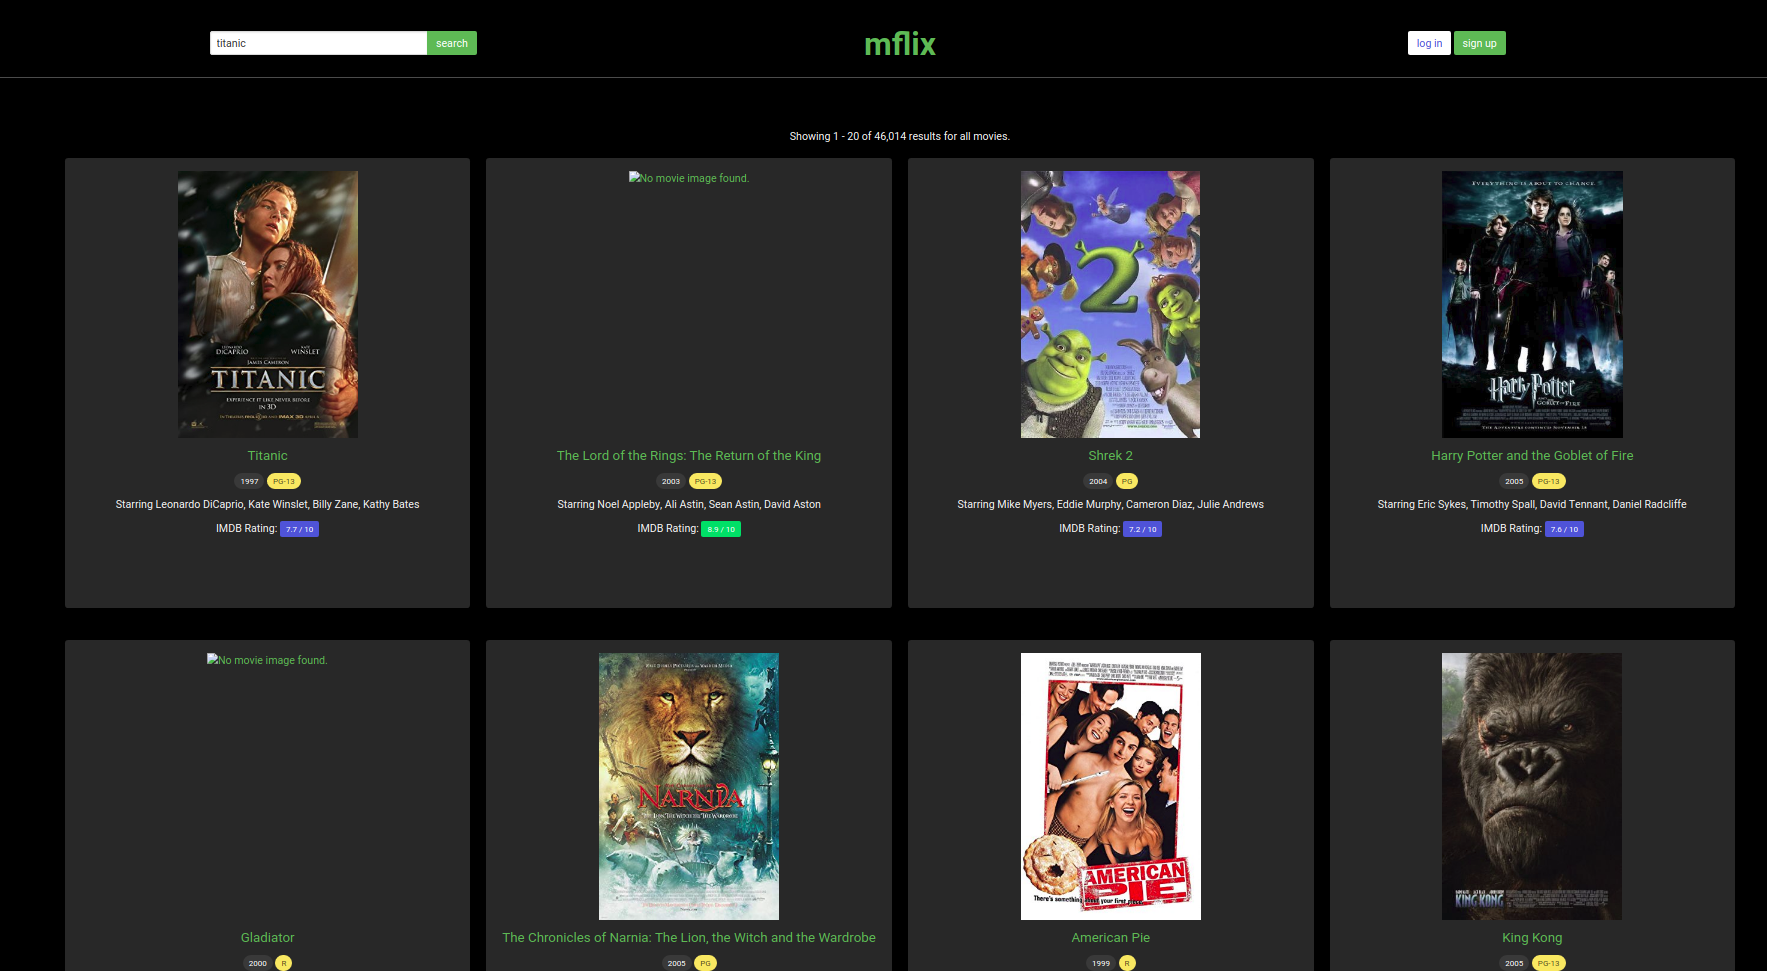
keywords : Flask ,Python, MongoDB , HTML , CSS , Boostrap
See GitHub page : https://github.com/kasamoh/NoSQL/tree/master/MongoDB/mflix
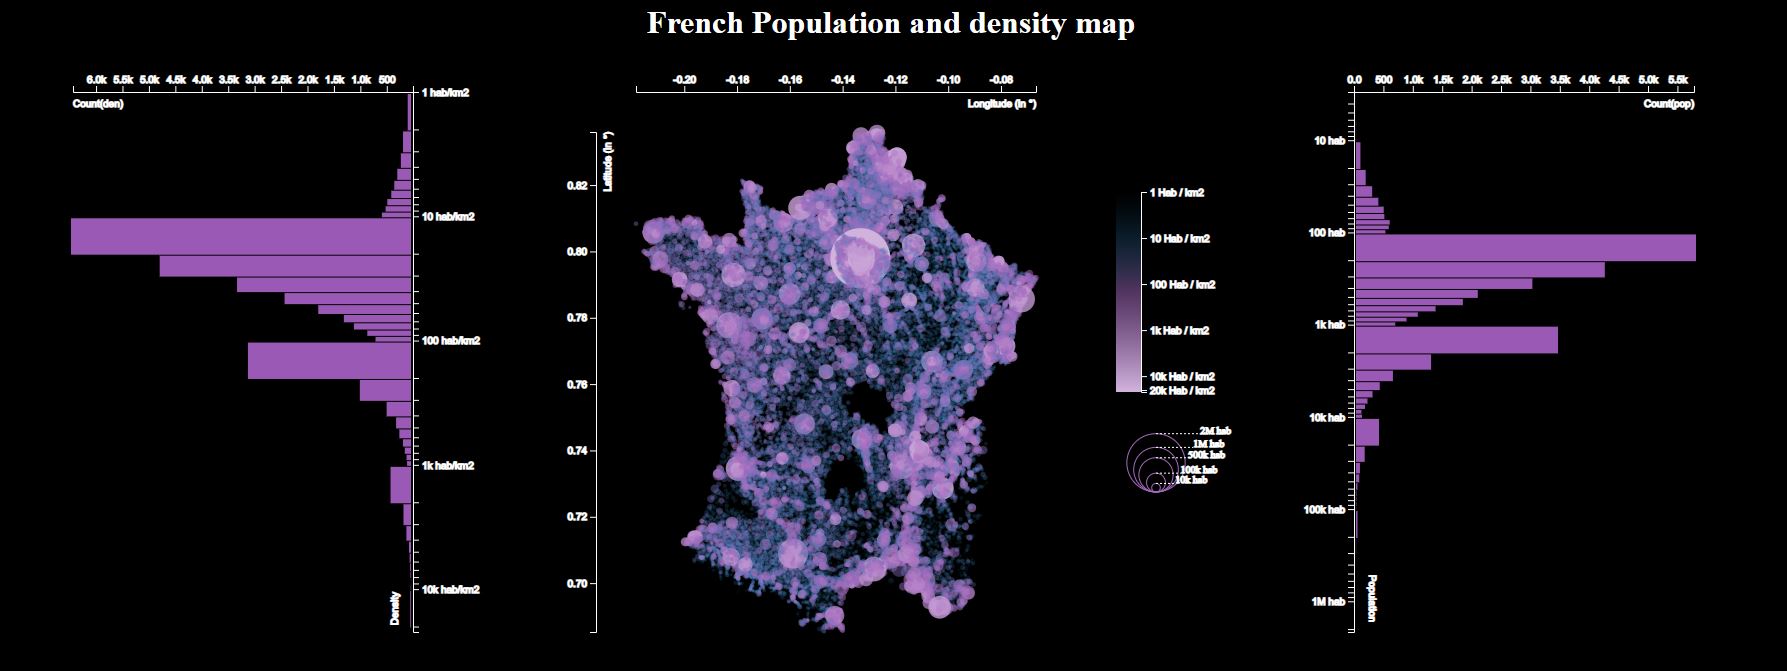
Visualization : Interactive Map of France using D3js
In this project, I created an interactive map with a few main features :
- Display the map of France (population and density)
- Change the color of the map with a simple button
- Display a tooltip with the name of the city and the postal code
- Display density and population histograms
First design :

Second design :
keywords : Flask ,Python, D3js , javascript , HTML , CSS , Boostrap
See GitHub page : https://github.com/kasamoh/Data-analysis/tree/master/Data%20Visualization/D3js
Visualization : Interactive Dashboard for energy analysis in France using React and D3js
Energy has become a main concern for a lot of people today. Enedis, through its website, has open a huge quantity of data to public. But due to the large amount of data available, this data can become very fast unfriendly and it can become very frustrated to navigate through it the data are directly available from Enedis dedicated website. Every user can find them here: https://data.enedis.fr/page/accueil/. There is a total of 60 different dataset spitted into 6 categories:
- Energy: giving insights on the production and consumption of energy in France, with different time splits and geography splits
- Environment: giving the electrical loading station for cars
- Exploitation: giving information about lines installed and blackouts
- Infrastructures: giving the architectures of low voltages and high voltages lines
- Electricity market: the datasets about Joule losses and market adaptation
These 60 datasets gather together millions of lines of data. One of the first tasks was to explore these data and decide which ones we will use for the project. We knew that there were a lot of data available, but we underestimated at first the time it would take to explore all these datasets and chose only data we wanted to dig more. As our target was to target most people, we went simply on the data related to Energy. The main questions we wanted to answer were as following:
- From where is coming the Energy we are using in France?
- How it is produced?
- What are the areas that produce more than what they consume?
- Who are the good examples to follow? Who are not?
- How all of this is evolving in time? But even after limiting the field of possibility, we had to choose also the scale we wanted to present the data as a lot of format was available. What temporality? What geographical mesh? Again, it is simplicity that drived our choices and we went to the largest scales:
- Year for the temporality
- Region for the geographical mapping.
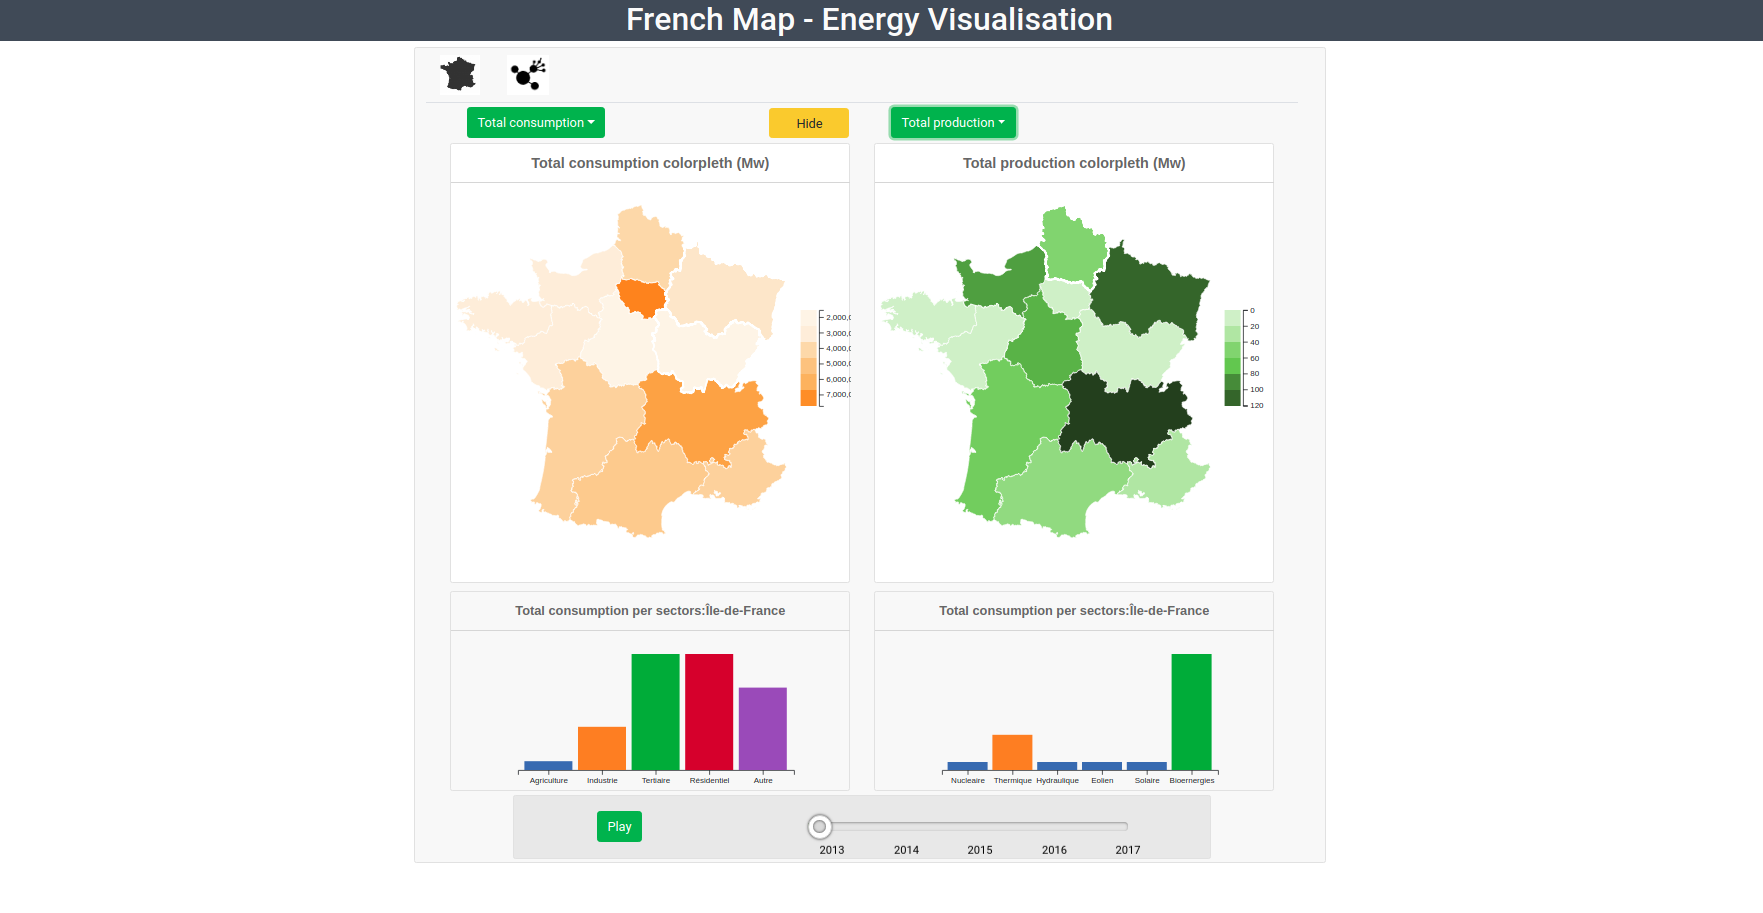
In this visualization project , I used python and many web technologies in order to implement the suggested design : I used python to clean and transform the data , Reactjs to handle and facilitate the interactivity and especially to implement reusable components that can be put together to form more complex components, and finally D3js to create the different graphs.
keywords : React, D3js , javascript , HTML , CSS , Boostrap ,Python
See GitHub page : [https://github.com/kasamoh/Infoviz_telecom)
Below a detailed report about the project :
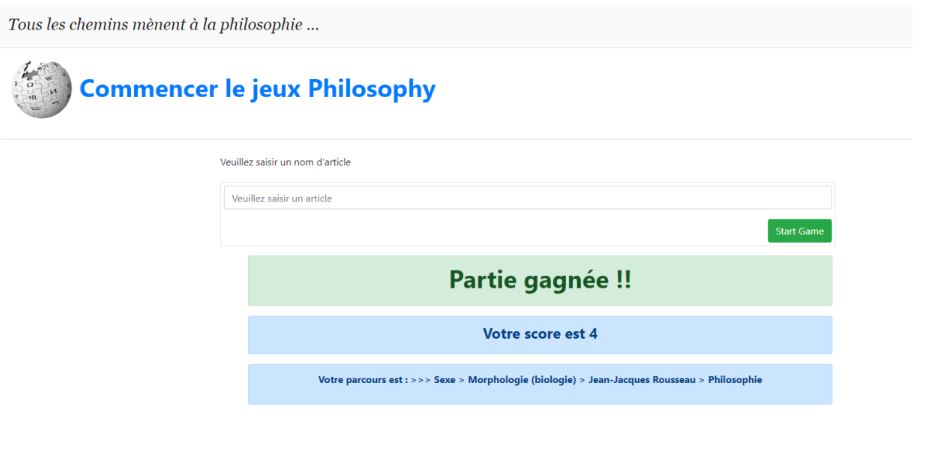
Web : Wikipedia Web App
According to ReadWriteWeb, all articles in the English version of Wikipedia lead to the article “Philosophy”. If you click on the first link of each article, you will come across the Philosophy article after a while.
In order to verify this assertion, I developped a small WebApp with 2 simple options :
- A manual Wikipedia Link explorer that requests Wikipedia’s API
- An automatic exploration that systematically chooses the first link among results
See GitHub page : https://github.com/kasamoh/WebApp/tree/master/WikiAPP
Classification :Click Through Rate Prediction using AVAZU dataset
Many ads are actually sold on a “pay-per-click” (PPC) basis, meaning the company only pays for ad clicks, not ad views. Thus your optimal approach (as a search engine) is actually to choose an ad based on “expected value”, meaning the price of a click times the likelihood that the ad will be clicked. In other words, a $1.00 ad with a 5% probability of being clicked has an expected value of $0.05, whereas a $2.00 ad with a 1% probability of being clicked has an expected value of only $0.02. In this case, you would choose to display the first ad.
In order for you to maximize expected value, you therefore need to accurately predict the likelihood that a given ad will be clicked, also known as “click-through rate” (CTR).

See GitHub page: https://github.com/kasamoh/Big-Data-mining/tree/master/AVAZU_CTR_Analysis
Classification : Predicting the predominant kind of tree (Kaggle)
In this challenge , I am trying to predict the forest cover type (the predominant kind of tree cover) from strictly cartographic variables (as opposed to remotely sensed data) .
See GitHub page : https://github.com/kasamoh/Data-analysis/tree/master/Kaggle
Econometrics : Time series Analysis and hypothesis testing
- Hypothesis testing
- Time series Analysis
Scala mini-projects :

- Financing rate prediction of Kickstarter.com projects
- Implementation a distributed k-means algorithm which clusters posts on the popular question-answer platform StackOverflow according to their score
- Using full-text data from Wikipedia to produce a rudimentary metric of how popular a programming language is
Deep Learning : Image Processing and learning
Below some image processing and learning projects :
- Realtime Landmarks recognition using Transfer Learning and open CV : https://github.com/kasamoh/Image_processing_learning/tree/master/Landmarks_Detection

-
Gender detection using deep learning with keras and cvlib : https://github.com/kasamoh/Image_processing_learning/tree/master/Gender_detection

-
Age Prediction in Keras :

Hackathons

-
Carrefour - Google Challenge : Development of Intelligent voicebot to enhance customer experience using Google Cloud Platform environment : https://machinelearningforbigdata.telecom-paristech.fr/fr/article/groupe-etudiants-ms-big-data-remporte-ai-retail-challenge
Cyber Security (Splunk)
I used Splunk in a Cyber Security Project. The aim of the project was to identify the source of a data leakage within the company. We went through the logs, identified suspect IP addresses, found the source of the attack (a corrupted PDF), estimated the volume of data stolen, and proposed immediate actions. We detailed the Diamond Model, the Cyber Kill Chain, and developped general perspectives for the Cyber Threat Intelligence of the company.