In this tutorial , we will introduce Dataiku Platform and build a simple data pipeline process into this awesome platform. Let’s start !
1- Dataiku
Dataiku Data Science Studio (DSS), a complete data science software platform, is used to explore, prototype, build, and deliver data products. It significantly reduces the time taken by data scientists, data analysts, and data engineers to perform data loading, data cleaning, data preparation, data integration, and data transformation when building powerful predictive applications.
![]()
It is easy and more user-friendly to explore the data and perform data cleansing. It supports datasets such as Filesystem, FTP, HTTP, SSH, SFTP, Cloud (S3), PostgreSQL, MySQL, Hadoop (HDFS), Oracle, MS SQL Server, Analytic SQL (Vertica, Greenplum, Redshift, Teradata, and Exadata), and NoSQL (MongoDB, Cassandra, and Elasticsearch).
Let’s enumerate some advantages of Dataiku :
- Collaboration : Versioning components like Github
- Productivity : Easy to use and well documented
- Code : Possibility to integrate python , scala , R ..
- Recipes : Data transformation , cleaning and Modelling without any code ( drag and drop operations )
- Visualization : Rich and easy-to use library of visualization.
In this blog, we will discuss about data cleaning, data transformation, and data visualization of titanic dataset using Dataiku DSS.
2- Getting started and Hands-on DSS training
The goal of the this training is to use Dataiku to build a machine learning model that predicts the passengers who survived the tragedy. To do so , we will use Titanic Dataset from this link .
I will come back later to the dataset and the modelling process , let’s focus now on Dataiku functionalities !
In order to start Dataiku , you need first to install it ! You can download and install Dataiku DSS Version 4.0.4 on Ubuntu from the official website
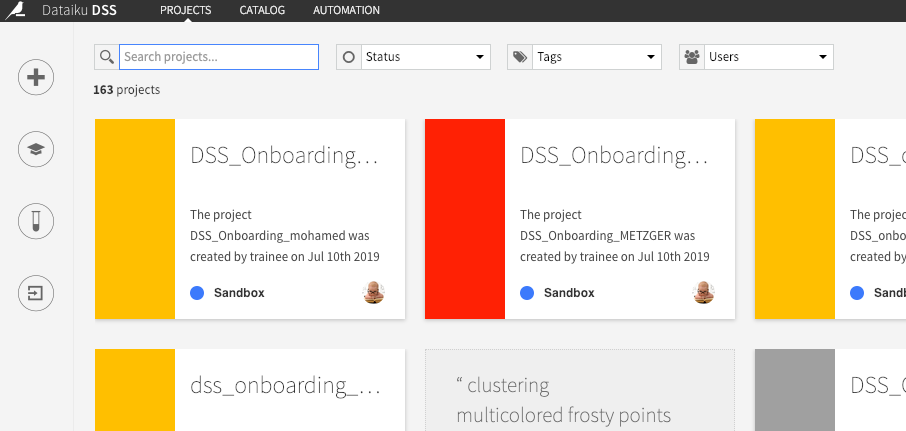
After installing Dataiku DSS , open it and you will get a screen like below :
2.1 Importing data
To import the dataset :
- Create a new project menu –> choose a name –> Click on Create
- Go to Flow
- One by one, upload the datasets in the zip and create DSS datasets
You can get back to Flow and double click on the dataset to visualize it ( you may need to switch to the explore menu )
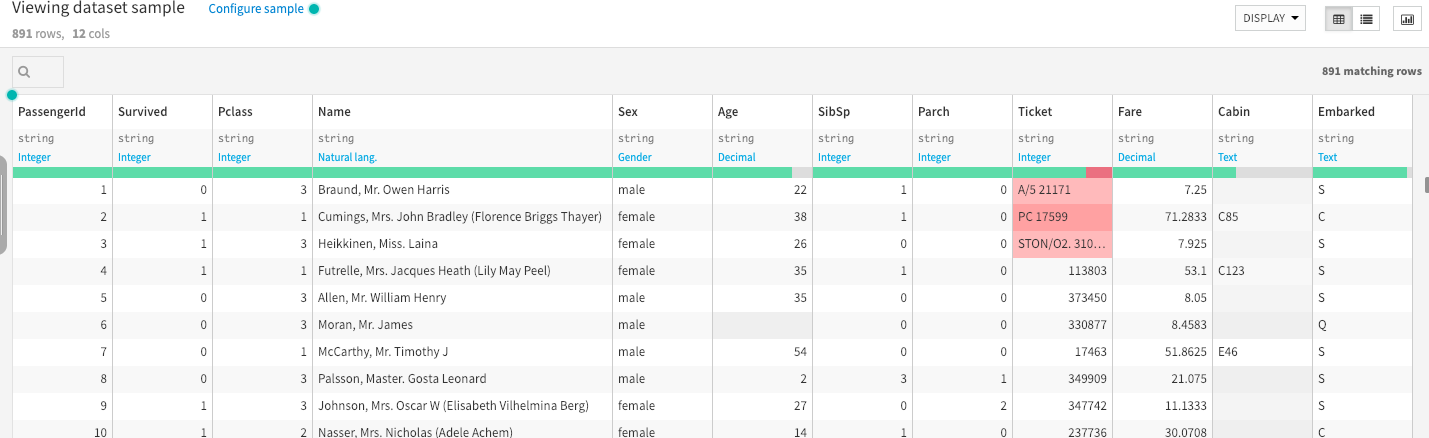
Dataset
The data has been split into two groups:
- training set (train.csv)
- test set (test.csv)
The training set should be used to build your machine learning models. For the training set, we provide the outcome (also known as the “ground truth”) for each passenger, which is the survival column. Your model will be based on “features” like passengers’ gender , sex , family_size , class …. You can also use feature engineering to create new features.
The test set should be used to see how well your model performs on unseen data. For the test set, we do not provide the ground truth for each passenger. It is your job to predict these outcomes. For each passenger in the test set, use the model you trained to predict whether or not they survived the sinking of the Titanic.
2.2 Data preparation
In this step , we will perform some basic data cleaning and preparation tasks :
-
Creating a new column “ family size “
-
Creating a column “Alone”
-
Extract the titles (Mr, Mrs etc.) from the “name” variable
-
Fill empty values in the column “age”
Family size column
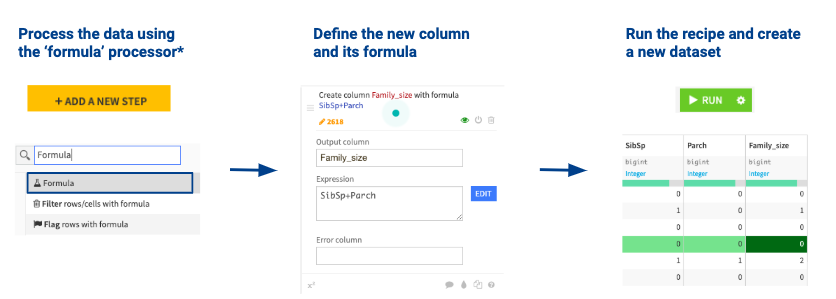
For every person, we will determine how many family members they are with on board : Family_size=SibSp + Parch
To do that :
- you need to select the dataset and then select the “prepare” recipe
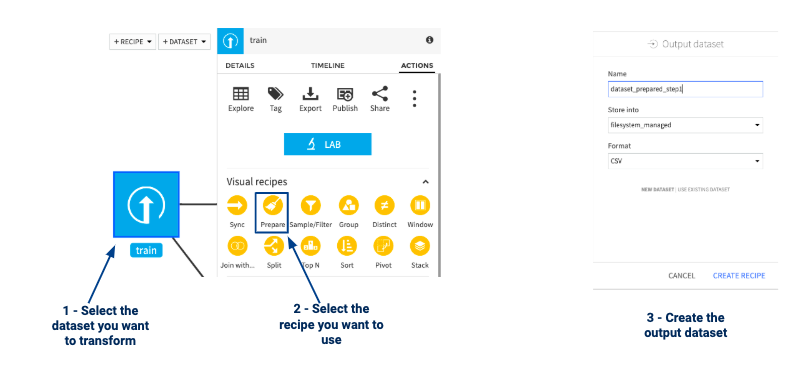
- Process the data using the ‘formula’ processor
Alone and Titles columns
With the same process , we can create Alone variable ( family_size > 0 ) and extract the title of the person ( ‘Mr’, ‘Mrs’ ..) using the prepare recipe ( a basic formula or a python script ) :
- Split on two times for the titles
- clip values outside [0,1] for the Alone variable
The empty data issue
Empty values are very often present in real life datasets and are an issue for machine learning models which expect all values to be filled
Various strategies exist to deal with this issue:
-
Removing the whole column
-
Removing the rows with empty data
-
Filling the value with an arbitrary value ( 0,median , mean …)
In our dataset , we have many empty values in the column “AGE” , We can fill them with the median for example , to do so :
- calculate manually the median by right click on the column and selecting summary
- click on the data , select prepare and in the formula put “fill empty cells with” , select “age “ as variable and “28” as value
- click on run
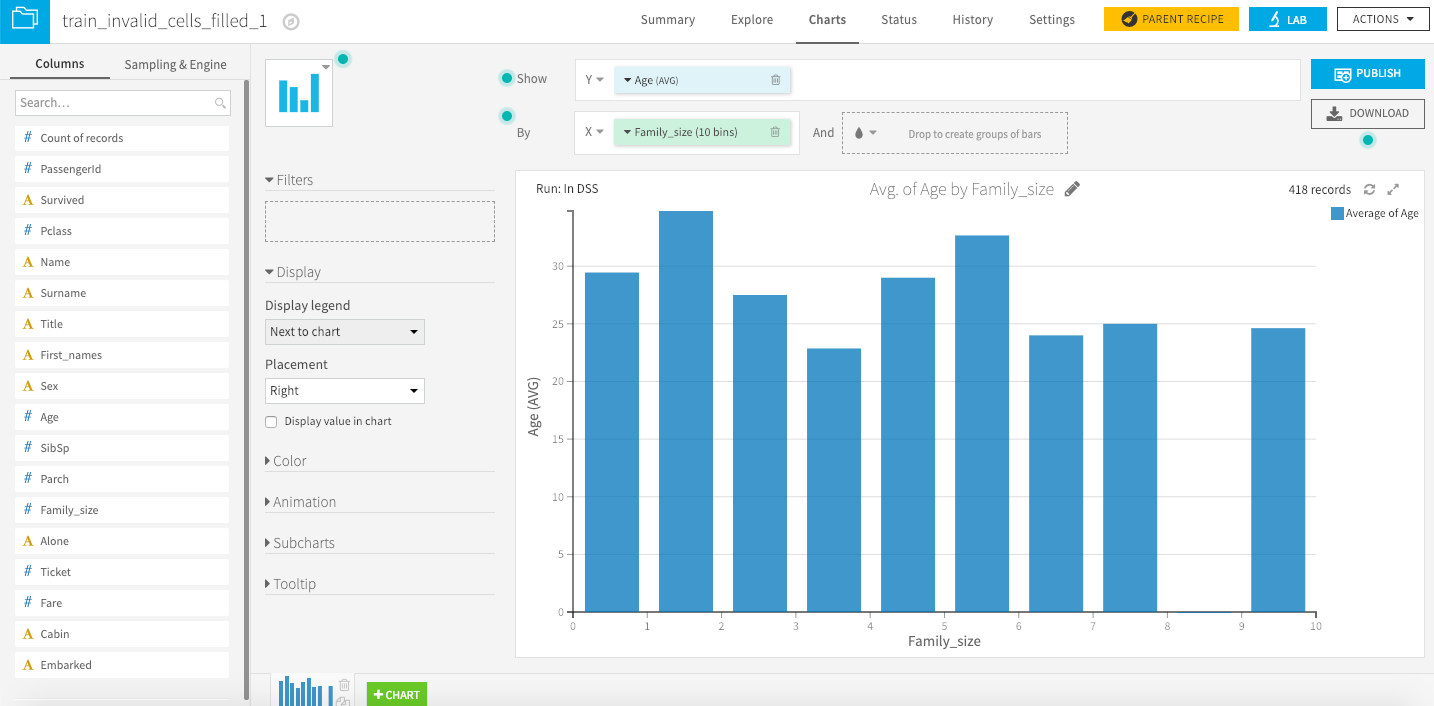
2.3 Data Viz
Go back to Flow , click on the final dataset and then explore .
Now you can switch to “Charts” menu in the navigation bar and now you can drag and drop column and display graphs , below an example :
3- Machine learning
- Select your cleaned dataset and create a Lab with a new visual analysis
- Create a model (here we desire a prediction model Set the following parameters: TARGET -> Survived TEMPLATE -> Performance BACKEND -> Python

-
Select the classification model you want ( Xgboost , DT …) and keep all the hyperparameters to their default values
-
Click on Train to start training your model.
After training , let’s make prediction on the test set, to do so , we need to reperform the data processing step on the test data :
- Go back to Flow , select all nodes until the one just before the model.
- Duplicate it
- Change the input dataset of the first duplicated recipe to the test dataset : Select the recipe. In the side panel go to Actions, then Edit, then Input/Output.Change input to your test dataset, then Save and Update schema.
- Re-run all recipes on the test dataset
- Select the model. In the side panel go to Actions, then Score. Select your prepared test dataset and create recipe. Define the parameters and run the scoring recipe.