If you are a machine learning practitioner, the following scenario is probably familiar to you : You have a machine learning project or idea, you look at the relevant literature, and start developing many models that are spread across jupyter notebooks, each relying on carefully crafted custom data loading pipelines with dozens of configurable parameters , graphs and metrics. So , It is clearly difficult to track which parameters, code, and data went into each experiment to produce a model.
So machine learning lifecycle comes with a set of concerns including reproducibility of models and predictions, diagnostics, testing , versioning, interpretability and continuous improvement and re-training of models. There are great open-source tools allowing to structure your machine learning lifecycle in a traceable and reproducible fashion. A great example is MLflow.
In this article, We will briefly describe what MLflow is and how it works.
1.Mlflow
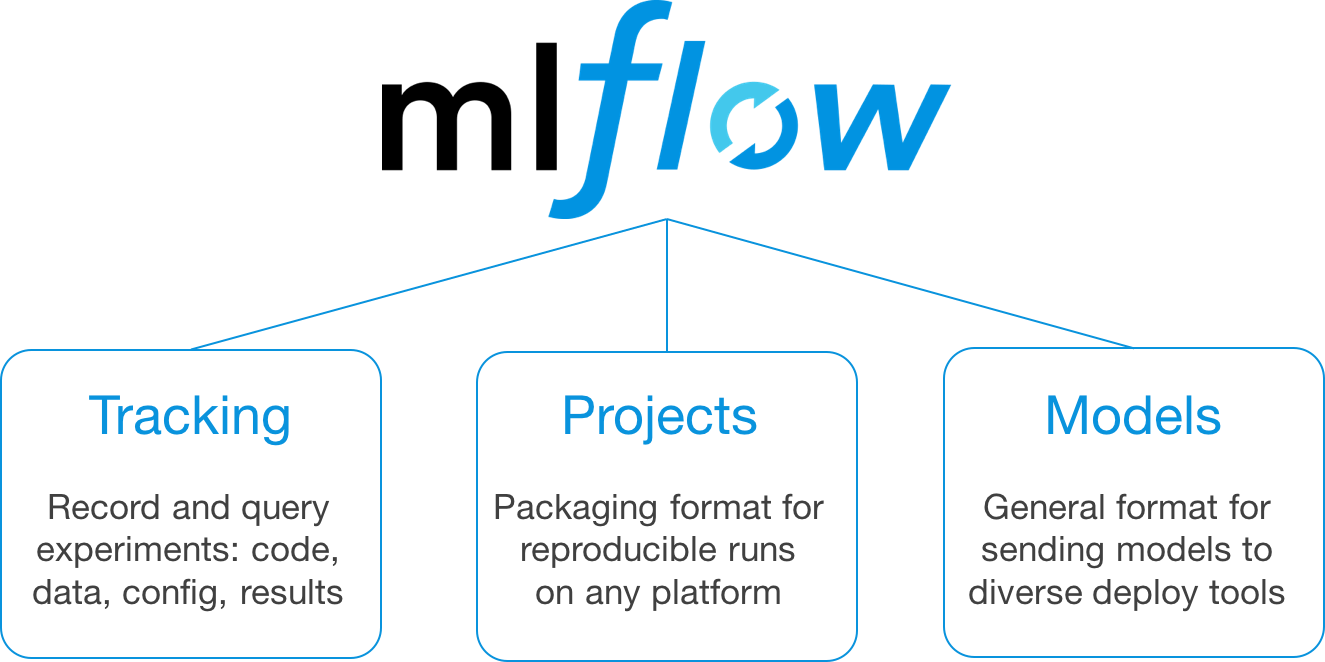
MLflow is an open-source platform that helps to manage the ML lifecycle, including experimentation, reproducibility, and deployment. It’s designed to work with any library or language and with only a few changes to existing code. The framework introduces 3 distinct features each with it’s own capabilities.
-
MLflow Tracking: Tracking is maybe the most interesting feature of the framework. It allows you to create an extensive logging framework around your model. This component allows you to log codes, custom metrics, data files, config and results. It also allows to query your experiments through which you visualize and compare your experiments and parameters swiftly without much hassle. We will mainly focus on this component in this article !
-
MLflow Projects: It provides structured format for packaging machine learning codes along with useful API and CLI tools.This feature uses its own template to define how you want to run the model on a cloud environment
-
MLflow Models: It is a standard format for packaging and distributing machine learning models across different downstream tools — for example, real-time serving through a REST API or batch inference on Apache Spark.
Well the theory is always nice but now it’s time for a more hand-ons approach. In the next two sections , We will present a guide on how to setup MLflow on a cloud environment and then on how to use Mlflow tracking component
2- Setup of MLflow :
Mlflow stores two types of data:
- Structured data: metrics of training progress and model parameters (float numbers and integers)
- Unstructured data: training artifacts (graphs, models, etc.)
We can either store these kind of data in a cloud databases or locally on VM. In this tutorial , we will opt for a cloud storage option :
- For training artifacts, we will use Google Cloud Storage (please note that AWS S3 and Azure Blob Storage are also supported).
- For the training metrics and parameters, we should use an SQL database . Mlflow supports mysql, mssql, sqlite, and postgresql
To observe the training progress we need to deploy MLflow server and run it locally (GUI to manage the stored data) and to connect it to the databases. The other option would be to deploy MLflow server on a VM and to store everything locally on it. In this article , we decided to proceed with the first option and to connect MLflow server to databases.
2.1 Step 0 : SET GOOGLE_APPLICATION_CREDENTIALS
You need to create and export a service account having at least the following permissions :
- Storage Object Admin
- Cloud SQL Editor
Then set the environment variable $GOOGLE_APPLICATION_CREDENTIALS to the service account path
export GOOGLE_APPLICATION_CREDENTIALS= path_to_service_account
2.2 Step 1 : Create SQL instance
-
Create and run a postgresql instance in GCP.
-
Create a database and a user in the sql instance
2.3 Step 2 : Setup connection to SQL instance
In order to connect to SQL Database, we have two options :
-
Set an external IP adress of the sql instance and connect to the database via the python command :
psycopg2.connect(host,port,database, user, password) -
Use Cloud Sql Proxy :
Dowload cloud_sql_proxy : curl -o cloud_sql_proxy https://dl.google.com/cloudsql/cloud_sql_proxy.darwin.amd64
Make the proxy executable : chmod +x cloud_sql_proxy
Start the proxy : ./cloud_sql_proxy -instances=[PROJECT_ID]:[Zone]:[InstanceName]=tcp:5432 -credential_file=$GOOGLE_APPLICATION_CREDENTIALS
For example : ./cloud_sql_proxy -instances=prev-boulpat-dev:europe-west1:mlflowsqlinstance=tcp:5432 -credential_file=$GOOGLE_APPLICATION_CREDENTIALS
In this tutorial, we will use the package psycopg2 to set the connection to the database
2.4 step 3 : Install postgresql
brew install postgresql pip install psycopg2
2.5 step 4 : Install Mlflow
pip install Mlflow
2.1 step 5 : Run mlflow server
In a new terminal , start the MLflow server with a command:
mlflow server --backend-store-uri
Example :
mlflow server --backend-store-uri postgresql://postgres_user:postgres_pass@127.0.0.1:5432/postgres_database --default-artifact-root gs://mlflow_warehouse
After that, your MLflow server should work. Check it by typing in the browser address line: http://127.0.0.1:5000 You expect to see a start page of your MLflow server:
3. How to use Mlflow
3.1 Initialization of experiment
After setting the connection to the postgresql instance and running mlflow server , let’s try to implement a basic machine learning pipeline and integrate MLflow into the workflow.
First , we import all the packages we will need in our experience :
import mlflow
from mlflow.tracking import MlflowClient
from mlflow.entities import ViewType
import mlflow.sklearn

import logging
import os
import fire
import numpy as np
import pandas as pd
from joblib import dump
from sklearn.decomposition import PCA
from sklearn.linear_model import SGDClassifier
from sklearn.model_selection import GridSearchCV
from sklearn.pipeline import Pipeline

logger = logging.getLogger()
logger.setLevel(logging.DEBUG)
The first thing to do is to reset the TRACKING URI and the GCS PATH path for artifacts :
gcs_bucket = "gs://mlflow_warehouse/"
mlflow_user = "postgres_mlflow_user"
mlflow_pass = "xxxxxxxxxx"
postgresql_database = "mlflow_experience_database"
tracking_uri = f"postgresql://{mlflow_user}:{mlflow_pass}@127.0.0.1:5432/{postgresql_database}"
mlflow.set_tracking_uri(tracking_uri)
Here, we highly recommend to set sensitive information as environement variables and then import them via the command os.getenv .
Then, we create an experiment. We can do it programmatically by using mlflow.create_experiment command . Mlflow do not authorize replacing an existing experience, so we need to check if the experience exist or not before creating it :
experiment_name = "experiment_iris_model"
## check if the experiment already exists
if not mlflow.get_experiment_by_name(experiment_name):
    mlflow.create_experiment(name=experiment_name,artifact_location=gcs_bucket)
experiment = mlflow.get_experiment_by_name(experiment_name)
It’s going to create a specific space in the UI to make your experiments more readable and a folder in the artifact uri where the experiment files will be stored.
3.2 ML workflow
Now, we will work on a simple machine learning workflow detailed as below :
- Loading IRIS data
- Performing PCA for feature reduction
- Using logistic regression to model the relation between our target and pca variables
- Optimizing the parameters using GridSearch
- Evaluating the model
- Exporting the model
We can start thinking about what do we want to keep track in our analysis/experiment. MLflow categorizes these into 3 main categories:
- Parameters (via mlflow.log_param() ). Parameters are variables that you change or tweak when tuning your model.
- Metrics (using mlflow.log_metric() ). Metrics are values that you want to measure as a result of tweaking your parameters. - Typical metrics that are tracked can be items like F1 score, RMSE, MAE etc.
- Artifacts (using mlflow.log_artifact() ). Artifacts are any other items that you wish to store. Typical artifacts that we can keep track of are pickled models , PNGs of graphs, lists of feature importance variables …
In the end, the training script becomes:
input_data_path = "data/iris.csv"
model_file ="iris_model.pkl"

with mlflow.start_run(experiment_id = experiment.experiment_id,run_name= f"run_{experiment_name}") :

    #-------Load data -----------#
    iris = pd.read_csv(input_data_path)
    X = iris.drop("Species", axis=1)
    y = iris.Species

    #-------Define model and parameters ----------#

    pca = PCA()
    logistic = SGDClassifier(loss='log', penalty='l2', max_iter=200, tol=1e-3, random_state=0)
    logistic.get_params()
    param_grid = {
                'pca__n_components': [2],
                'logistic__alpha': np.logspace(-2, 1, 2),
            }
    mlflow.log_params(param_grid)
    pipe = Pipeline(steps=[('pca', pca), ('logistic', logistic)])

    #--------Training ----------#

    logging.info("beginning training")
    search = GridSearchCV(pipe, param_grid, iid=False, cv=2, return_train_score=False)
    search.fit(X, y)
    logging.info(f"Best parameter (CV score={search.best_score_}):")

    best_param_renamed = {f'best_{param}': value for param, value in search.best_params_.items()}
    mlflow.log_params(best_param_renamed)
    mlflow.log_metric("best_score", search.best_score_)

    #--------Save best model ----------#

    logging.info("saving best model")
    dump(search.best_estimator_, model_file)
    mlflow.log_artifact(model_file)
    #mlflow.sklearn.log_model(search.best_estimator_,"test_model")
    #mlflow.pyfunc.log_model(model, python_model=ModelWrapper())
    mlflow.log_params({"model_file":model_file})
3.3 Tracking experiments
We can use the mlflow.search_runs() function to get all the details about our experiments . This function takes filter_string as a parameter which act as a filter to the query and returns a pandas.DataFrame of runs, where each metric, parameter, and tag are expanded into their own columns named metrics., params., and tags.* respectively.
history_run = mlflow.search_runs(ViewType.ACTIVE_ONLY)
history_run
If we want to get a specfic experience parameters based on the accuracy parameters , we start by looking for it’s run_id and then we can deduce the uri of the artifacts :
run_id = history_run.loc[history_run['metrics.best_score'].idxmax()]['run_id']
atf_uri = history_run.loc[history_run['metrics.best_score'].idxmin()]['artifact_uri']
model_name = history_run.loc[history_run['metrics.best_score'].idxmin()]['params.model_file']
model_uri = f"{atf_uri}/{model_name}"
model_uri
I’m under the iris experiment, and we can see all the runs. It is also possible to search specific runs with a SQL-like syntax by filtering with some parameter, metrics or value.
3.4 Navigate the UI
Now, you can navigate the Mlflow User Interface by typing http://127.0.0.1:5000 in a navigator , you will have access to a more detailed view:
You can still see parameters and metrics, but you can also add some notes, tag the run and even look at the artifacts you’ve saved. All the information is saved and accessible in a convenient way.
4- Webography
-
https://towardsdatascience.com/tracking-ml-experiments-using-mlflow-7910197091bb
-
https://towardsdatascience.com/colab-synergy-with-mlflow-how-to-monitor-progress-and-store-models-fbfdf7bb0d7d
- https://github.com/mlflow/mlflow/blob/master/mlflow/tracking/fluent.py
-
https://github.com/nithin8702/mlflow/blob/master/churn.py
-
https://www.thomaslegrand.tech/python/2019/07/26/mlflow-iris.html
- https://medium.com/analytics-vidhya/retrieving-the-best-model-using-python-api-for-mlflow-7f76bf503692